|
Steve
Salis acted as Instructional Designer / Project Manager / Head Writer
& Editor, and supervised a staff of 15 programmers, writer/producers,
graphic artists, out sourced suppliers, video and audio personnel.
He personally wrote 2/3 of the material.
|
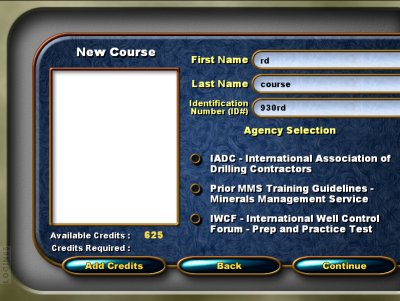 |
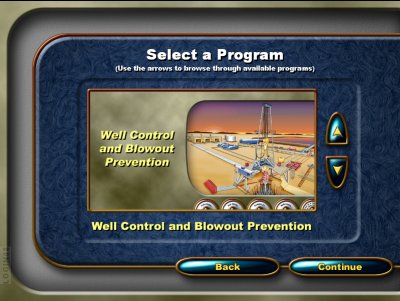
Certification Selection screen.
The course contains 2000+ content topics, called nuggets. 26
courses can be made from these topics. The course the user takes
depends upon the certification selected, job level and field of study
(such as land based or off-shore based).
The content is designed to be self contained so a content nugget
can be seamlessly butted against a number of other content nuggets.
Clever design also assures that a user will only see questions that are
covered in his course.
|
 |
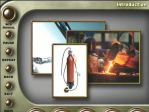
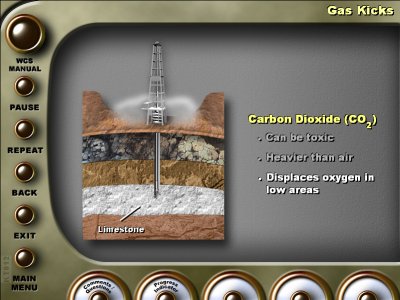
The content is presented in a dynamic manner. A male
narrator provides the instruction and every few seconds, a new image
appears (the image to the right was "grabbed" as the lower left
image was dissolving on), or text appears to reinforce the
narration.
The screen changes are cued to the narration.
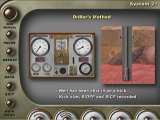
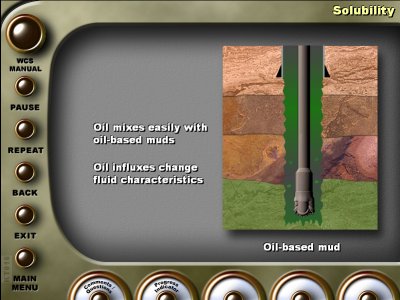
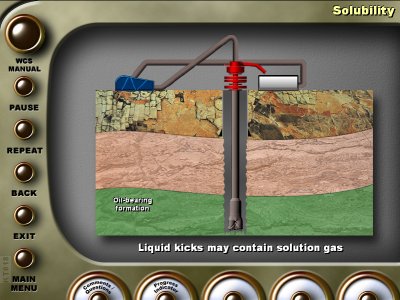
The 2 screens below are examples of simple "flash" animation nuggets.
On the Solubility screen (lower left), the drill bit lowers as it spins,
the hole gets bigger and bubbles rise in the well while the fluid (green)
flows up the well at a different rate.
Below, the gas fog appears around the rig after the bit penetrates the labeled
rock layer.
|
 |
 |
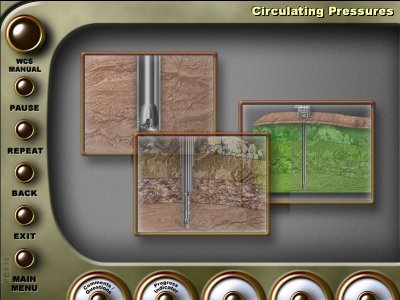
An example of a more complex animation involving the entire circulation
system. |
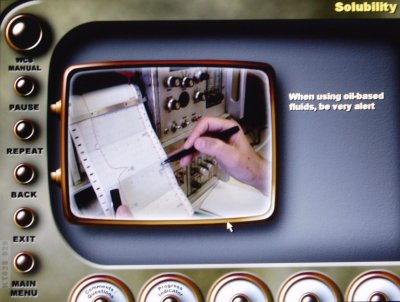
The course contains over 500 video sequences. All of which are augmented
with text to emphasize key points. |
|
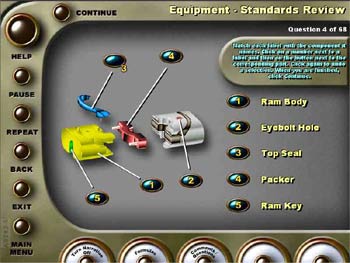
The quizzes and tests include: True/False, Multiple choice
and matching questions like the one shown here.
The user clicks a number and drags it to the proper identifying
location.
The question are narrated by a female announcer. It is possible
to switch the question narration off by clicking the appropriate smart
button at the bottom of the screen.
|
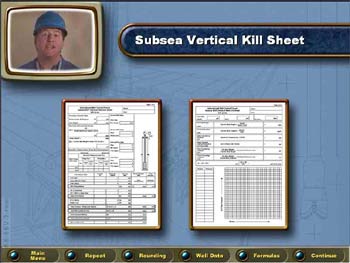 |
To teach math operations, 4 examples each of 4 different
worksheets are available. A user will see up to 4 randomly selected
sheets. A video tutor provides instructions.
A user must make over 100 calculations and entries on each of the
sheet.
Steve Salis acted as Instructional Designer and writer in addition
to Project Manager. |
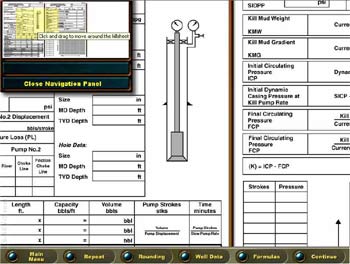 |
The sheet is navigated by the navigation panel in the upper
left. to move around the worksheet, simply click the yellow shaded
box and drag it to the desired location. The larger worksheet moves accordingly
in real time. |
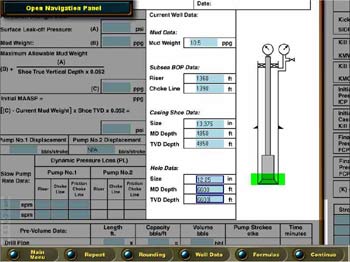 |
The Instructor walks the user through the first
sections. When an incorrect entry is made into on the blue shaded
boxes, the narrator informs the user of the mistake and tells him how to
correct it. |
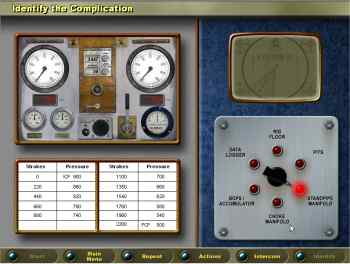 |
This is an example of an "Identify the
Complication" exercise. An on screen tutor sets the scene and
then the panel on the left is activated. A user is required to
observe the panel for unusual reading. An intercom is available at
the lower right. Via this intercom a user can ask questions to other
crew members to improve situational awareness. Crew member responses
are seen and heard on the video monitor.
The complication must be identified in a specified period of time and
the user must make few mistakes to receive a passing score. |
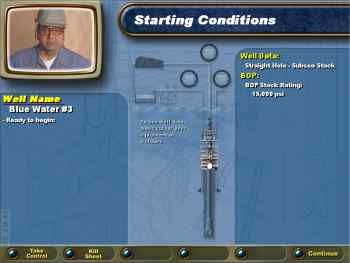 |
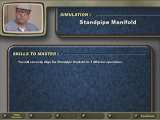
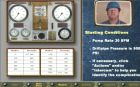
One of 17 simulations
Simulations are introduced by a tutor. These simulations are
photo realistic and very challenging to reflect real world problems.
This is the Starting Conditions screen. Status information can be
learned by moving the mouse over portions of the graphic. |
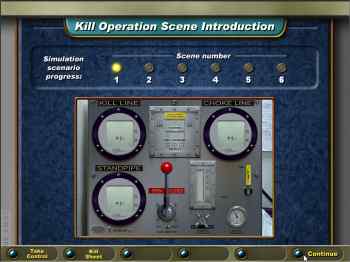 |
This is the simulation control panel. When ready, a
user clicks the continue button and the panel fills the frame. The
mouse is used to adjust the onscreen levers and dials.
It takes approximately 45 minutes to complete this most complicated of
the simulations. |
| For even more information about this project visit the
customer's site by clicking here. |
|